In order to fully explain the functionality of the TRANSFORM...PIVOT statement, lets start by looking at this simple SQL query statement:
SELECT CUSTNO, SALEDATE, AMOUNTPAID FROM ORDERS ORDER BY CUSTNO, SALEDATE
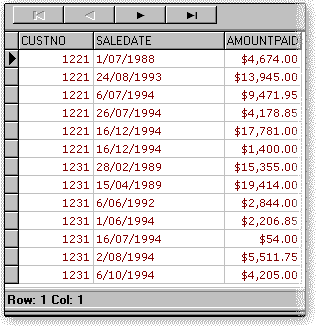
This query applied against the Orders table that comes with Delphi will give us a result like this:

As you can see, the result of the query is ordered first by CUSTNO, and next by SALEDATE, and also will show the amount paid by the Customer in that order.
What we want now, is this same statement, but this time, the AmountPaid field must be grouped by year in order to obtain the total sales for every customer and for all the years. We can do this with the following statement.
SELECT CUSTNO, EXTRACT(YEAR FROM SALEDATE) AS SALEYEAR, SUM(AMOUNTPAID)
FROM ORDERS GROUP BY CUSTNO, 2 ORDER BY CUSTNO, 2
This SQL statement can be interpreted as this:
•In the SELECT section, the field CUSTNO is included in the result set.
•Also, the SQL function EXTRACT is used to extract only the year part of the field SALEDATE.
•Next, the aggregate function SUM(AmountPaid) is used in order to sum this field for the grouping of the first two columns as is defined later in the GROUP BY clause.
•The section FROM defines the table to query, which in this case is ORDERS.
•The GROUP BY clause is used to indicate the fields that the grouping will be done. In this case, when an expression is used in the included fields in the SELECT clause, that column must be referenced by its ordinal position, starting from 1. Then in this case, the EXTRACT function is used in the second column. Also, the grouping could be defined this way: GROUP BY 1,2
•Finally, the result set is ordered by the first two columns also. That is the same order of the grouping in order to get the desired results.
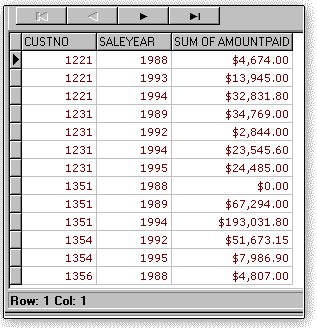
The result of querying the table with this SQL statement will give the result shown in the following figure:

It's clear from the rows returned by the preceding query and illustrated in previous figure, that a substantial rearrangement of worksheet cells is required if you import this data into a worksheet that is intended to display data in time-series format. In this example, it is clear that you may want to show the sum of sales for every year and for every customer but listed for years and one year for every column.